
A flowchart shared as a PNG, JPG, or screenshot may communicate the process clearly, but it is difficult to update. The labels, decision points, arrows, and containers are locked together as pixels, so even a small wording change can require rebuilding the diagram from scratch.
This guide explains how to reconstruct a flat flowchart image as an editable PowerPoint draft, then review its labels, shapes, and visible connections before reusing it in a presentation.
Important
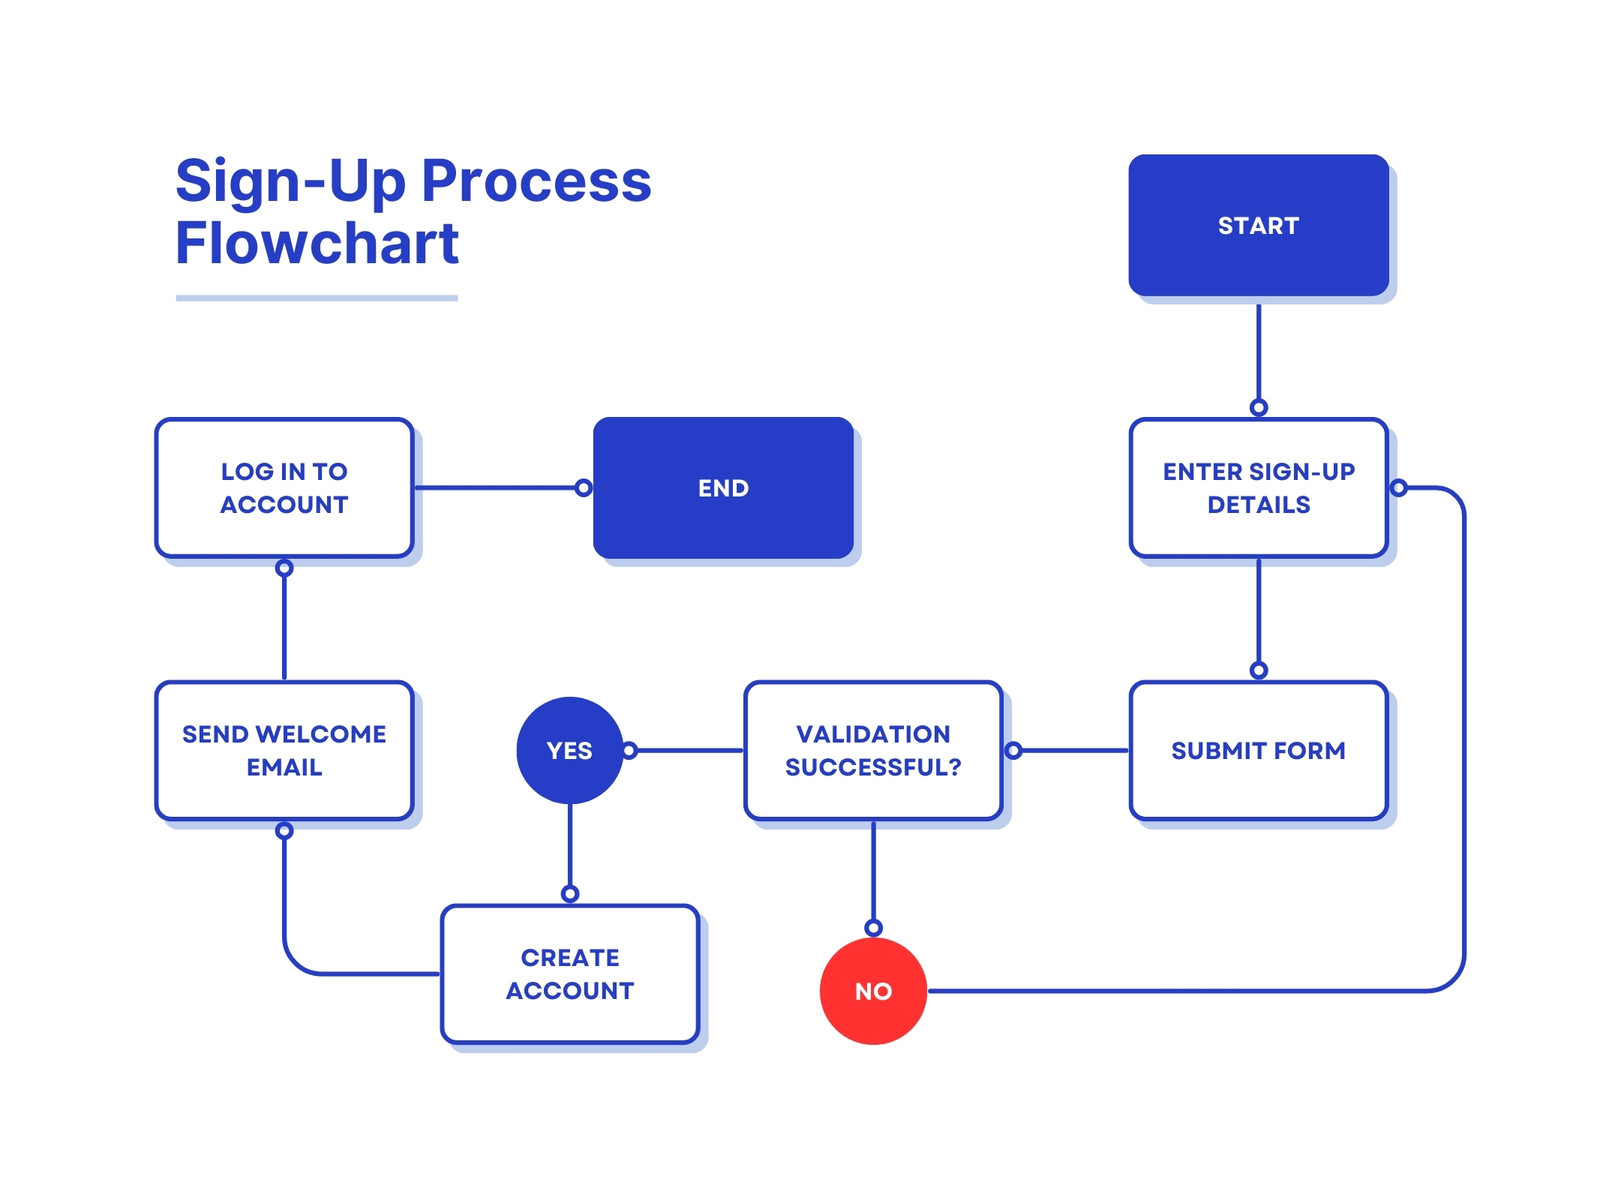
Can you convert a flowchart image to PowerPoint?
Yes. A clear flowchart image can be rebuilt as a PowerPoint slide with editable labels and separated visual elements where possible. Simple boxes, lines, arrows, and other structural regions are easier to reconstruct than dense diagrams with overlapping connectors.
Simply inserting the flowchart into PowerPoint gives you one picture. Reconstruction instead analyzes the visible regions and creates a new slide that is easier to revise, restyle, and combine with the rest of your presentation.
| Approach | PowerPoint result | Editing options |
|---|---|---|
| Insert the flowchart image | One flat picture | Resize or crop the whole diagram only |
| Reconstruct the flowchart | Editable labels + separated visual regions | Revise copy, positioning, and styling |
| Redraw the flowchart manually | Native objects created one by one | Full control, but requires more time |
What flowchart images work best?
Reconstruction works best when the full diagram is visible and its labels and connector paths are easy to distinguish from the background.
- PNG or JPG exports from diagram and whiteboard tools
- Flowchart screenshots with the complete canvas visible
- Process diagrams exported from PDF pages
- Scans of printed diagrams with strong contrast and straight edges
- Simple decision trees with readable labels and clear arrowheads
Best: Direct PNG export
Sharp text, clean lines, and complete edges provide the strongest source for reconstruction.
Good: High-resolution screenshot
A clean screenshot works well when toolbars, cursors, and selection handles are removed.
Review carefully: Dense routing
Crossing lines and closely spaced arrowheads can make connector relationships ambiguous.
Avoid: Cropped diagram
Missing nodes or connector endpoints cannot be inferred reliably from the remaining pixels.
How to convert a flowchart image to PowerPoint
Choose the highest-resolution version of the flowchart and confirm that every node, label, connector, and arrowhead is visible. Once the source is ready, the conversion follows three steps.
1. Upload the flowchart image
Go to Diagram to PowerPoint and upload the PNG, JPG, JPEG, or WebP image. Use the original export when possible rather than a compressed image copied from a message or document.
2. Let SlideRebuild analyze the diagram
The system detects readable labels, graphic regions, connector paths, arrowheads, and alignment, then rebuilds the visible diagram as a PowerPoint slide. Complex or tightly grouped regions may remain images when that better preserves their appearance.
3. Review and download your PPTX
Review the reconstructed slide, download the PPTX, and open it in PowerPoint. Compare every important branch with the original image, then correct labels, line positions, and spacing before presenting the diagram.
Related workflow
What becomes editable?
The output depends on the image quality and diagram complexity. Reconstruction prioritizes labels and structural elements that are most useful to change in PowerPoint.
| Flowchart element | Typical result | What to review |
|---|---|---|
| Node and decision labels | Editable text boxes | Spelling, line breaks, and alignment |
| Simple boxes and decision shapes | Editable shapes where possible | Size, fill, border, and corner style |
| Lines and arrows | Separated connectors or graphic regions | Endpoints, direction, and crossing paths |
| Icons inside nodes | Separated image or shape regions | Positioning and background edges |
| Complex grouped sections | Preserved image regions | Crop boundaries and visual fidelity |
PowerPoint objects rebuilt from a flat image do not automatically regain the behavior of the original diagram application. A visible connector may look correct without being semantically attached to a node, so move and test important elements during review.
Tips for reviewing the rebuilt flowchart
Check the diagram as a system rather than reviewing labels in isolation. A small change to one node can affect connector positions, spacing, and the readability of the entire process.
- Compare every node and branch with the original image
- Proofread decision labels, numbers, acronyms, and punctuation
- Confirm that every arrow points in the intended direction
- Inspect crossing, faint, curved, and partially hidden connectors
- Align repeated nodes and make their spacing consistent
- Apply a consistent font, fill color, border, and line weight
- Test moved nodes to see whether their connectors still need adjustment
If the diagram is too dense for one presentation slide, split it into a high-level overview followed by detailed sections. The rebuilt elements can then be enlarged without forcing the audience to read tiny labels.
Frequently asked questions
Can a flowchart screenshot become editable in PowerPoint?
Will every box and arrow become a PowerPoint shape?
Will connectors remain attached when I move a node?
Can I convert flowcharts exported from PDF?
Can I convert several flowcharts into one deck?
Does this create a Visio or editable diagram source file?
Make the flowchart editable
Rebuild your flowchart as an editable PowerPoint slide
Upload a clear flowchart image and reconstruct its visible labels, shapes, connectors, and layout as a PPTX draft ready for review.