
A data infographic can summarize a complex topic in one visual, but a PNG, JPG, or screenshot locks the statistics, labels, icons, and layout together. When a number changes or the design needs to match a new presentation, editing the flat image becomes difficult.
This guide explains how to reconstruct a data infographic as an editable PowerPoint draft, verify the visible facts, and adapt the information hierarchy for a presentation audience.
Important
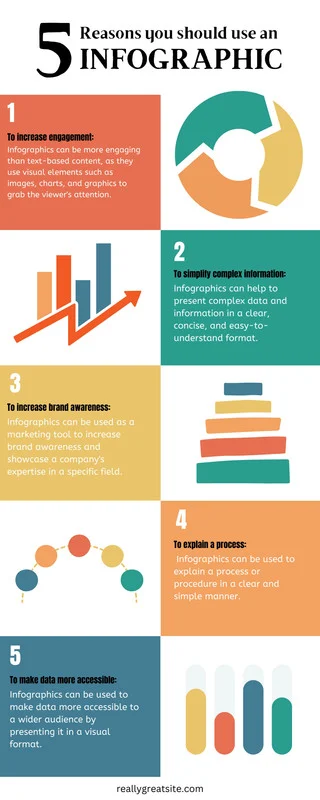
Can you convert a data infographic to PowerPoint?
Yes. A clear infographic image can be rebuilt as a PowerPoint slide with editable headings, labels, values, and separated graphic regions where possible. This gives you a practical draft for correcting copy, updating branding, and reorganizing the visual story.
Inserting the infographic directly into PowerPoint creates only one picture object. Reconstruction analyzes the visible sections and rebuilds the content that is most useful to edit while preserving complex artwork when converting it to simple shapes would reduce fidelity.
| Approach | PowerPoint result | Editing options |
|---|---|---|
| Insert the infographic image | One flat picture | Resize or crop the complete visual |
| Reconstruct the infographic | Editable copy + separated visual regions | Revise wording, layout, and suitable styling |
| Recreate from source data | Native charts and presentation objects | Full data control when the original files are available |
What data infographics work best?
The strongest source has a complete canvas, readable labels, clear section boundaries, and enough resolution for small values and footnotes to remain legible.
- Original high-resolution PNG or JPG infographic exports
- Data summaries with distinct sections and strong contrast
- Infographics with readable headings, values, and legends
- Presentation-sized visual panels with a landscape aspect ratio
- Long infographics divided into logical slide-sized sections
Best: Original PNG export
Sharp lettering, complete edges, and clear graphics provide the strongest reconstruction source.
Good: Structured data story
Distinct titles, statistics, charts, and supporting notes are easier to separate and review.
Review carefully: Tiny sources
Footnotes, citations, and compact legends are more likely to require proofreading after conversion.
Avoid: Social thumbnails
Heavy compression and reduced dimensions can blur numbers, axes, and small labels.
How to convert a data infographic to PowerPoint
Use the original export whenever possible. If the infographic is much taller than a standard slide, divide it into logical sections first so each reconstructed page remains readable.
1. Upload the infographic image
Go to Infographic to PowerPoint and upload the PNG, JPG, JPEG, or WebP file. Make sure the full visual is present and no values, labels, legends, or source notes are cropped.
2. Let SlideRebuild analyze the visual sections
SlideRebuild detects headings, statistics, captions, icons, chart regions, colors, and alignment, then rebuilds the visible information as a PowerPoint slide. Detailed charts and illustrations may remain as positioned image regions.
3. Review and download your PPTX
Compare the reconstructed slide with the source infographic, verify all data and labels, then download the PPTX. Open it in PowerPoint to refine the layout, apply presentation styling, or divide dense content across additional slides.
Converting a long infographic
What becomes editable?
Editability depends on the clarity and complexity of each region. The goal is to make important copy and reusable structure easier to change without damaging the visual story.
| Infographic element | Typical result | What to review |
|---|---|---|
| Headings and explanatory copy | Editable text boxes | Spelling, line breaks, and font match |
| Values, labels, and legends | Editable when clearly readable | Digits, units, decimal points, and percentages |
| Simple panels and dividers | Editable shapes where possible | Fill colors, borders, spacing, and alignment |
| Icons and illustrations | Separated graphic or image regions | Crop boundaries and visual consistency |
| Detailed charts | Preserved image regions with editable labels where possible | Data accuracy, axes, legends, and source notes |
A chart that looks correct is not the same as a chart connected to editable data. If you need to update values or change the chart type, rebuild that chart from the verified source dataset in PowerPoint or Excel after conversion.
Frequently asked questions
Can I convert a PNG infographic into editable PowerPoint?
Will charts become editable PowerPoint charts?
Can I update the numbers after conversion?
Should I split a long vertical infographic first?
Can small citations and footnotes be recovered?
Can I edit the result in Google Slides?
Turn your infographic into slides
Make your infographic editable
Upload your infographic and rebuild its copy, data labels, and visuals in an editable PowerPoint.